AKEBONO REPORT 2011
19/40
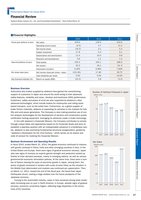
AKEBONO REPORT 2011 Akebono Brake Industry Co. Ltd. 17■Financial Highlights a2009 2010 2011Fiscal year (billions of yen): Net sales 159.6 130.6 216.6Operating income (loss) (6.3) 4.7 11.4Net income (loss) (16.3) 2.1 5.3Capital investment 17.8 5.4 5.1Depreciation and amortization 11.4 10.0 9.8Research and development 2.6 1.1 1.3Year-end (billions of yen): Total assets 155.4 164.1 186.0Net assets 32.2 49.1 54. 6Associates (number) 6 405 6 984 7 659Per share data (yen): Net income (loss) per share?basic (151.65) 17.80 39.75Cash dividends per share 5.00 5.00 10.00Key financial indicator (%): Return on equity (ROE) (42.2) 5.8 11.6Financial ReviewAkebono Brake Industry Co. Ltd. and Consolidated Subsidiaries Years Ended March 31Performance Report for Fiscal 2010Business OverviewAutomotive disc brakes supplied by akebono have gained the overwhelmingsupport of customers in Japan and around the world owing to their advancedsafety features reliability and noise vibration and harshness (NVH) performance.Customers’ safety and peace of mind are also supported by akebono’s otheradvanced technologies which include brakes for motorcycles and rolling stockbasedtransport such as the bullet train. Furthermore as a global supplier ofbrake friction materials akebono is expanding its activities in the markets for forkliftsand wind power generators. The Company is also making practical use of controlanalysis technologies for the development of sensors and construction qualitycertification testing equipment leveraging its advances made in brake technology.In line with akebono’s Corporate Mission the Company contributes to societythrough unique ideas and approaches based on its Corporate Goals and aims toestablish a peerless position with an indispensable presence in a borderless society.akebono is also promoting fundamental structural reorganization guided by“akebono’s Declaration for the 21st Century ” which serves as its stance andcode of conduct for realizing the Corporate Mission.Business Environment and Operating ResultsIn fiscal 2010 ended March 31 2010 the global economy continued to improve with growth centered in China India and other emerging countries in Asia. In theUnited States and Europe there were signs of gradual economic recovery. Japanalso saw signs of recovery as exports gained strength and production picked upthanks to brisk demand overseas mainly in emerging nations as well as variousgovernmental economic stimulation policies. At the same time there were a numberof factors slowing the pace of economic growth in Japan among them theprices of goods increased in tandem with crude oil price hikes as the situation inthe Middle East deteriorated and markets saw continued yen appreciation. Then on March 11 2011 toward the end of the fiscal year the Great East JapanEarthquake struck casting a large shadow over the future prospects of theJapanese economy.Turning to the automobile industry sales in Asia remained strong while moderatelyincreasing year on year in North America. In Europe despite signs of gradualrecovery economic uncertainty lingers reflecting large disparities in the economiesof EU countries.(Billions of yen)173.2060120180240184.7159.6130.6216.62007 2008 2009 2010 2011Net Sales(Million units)11.5005101511.7910.018.86 8.992007 2008 2009 2010 2011Number of Vehicles Produced in JapanFeature Social Repor t Environmental Repor t Economic Report Reference Materials
元のページ