AKEBONO REPORT 2011
20/40
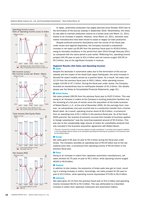
18 AKEBONO REPORT 2011 Akebono Brake Industry Co. Ltd.In Japan automotive production has largely declined since October 2010 due tothe termination of the eco-car subsidy in September 2010. Nevertheless the industrywas able to maintain production volume at a certain level until March 11 2011 thanks to an increase in exports. However since March 12 2011 domestic automotivemanufacturers have been forced to cease or largely cut back production.Despite profound economic fluctuations over the course of the fiscal yearunder review and regional disparities the Company recorded a substantialincrease in net sales (up 65.8% from the previous fiscal year) to ?216.6 billion owing to favorable conditions in the period from April 2010 through February 2011as compared with the same period a year earlier. Reflecting this operating incomejumped 144.3% year on year to ?11.4 billion and net income surged 155.5% to?5.3 billion due to the significant increase in revenue.Segment Results (Net Sales and Operating Income)● JapanDespite the decrease in automotive sales due to the termination of the eco-carsubsidy and the impact of the Great East Japan Earthquake the solid increase indemand for export models served as a positive factor. As a result net sales rose12.1% from the previous fiscal year to ?93.1 billion while operating incomesurged 110.9% to ?7.1 billion. During the fiscal year under review the Companyrecorded an extraordinary loss on earthquake disaster of ?1.3 billion. (For details please see the Notes to Consolidated Financial Statements page 33.)● United StatesNet sales jumped 199.0% from the previous fiscal year to ?107.0 billion. This wasowing to an increase in orders at the Company’s existing production facilities andthe recording of a full year of results since the acquisition of the brake businessof Robert Bosch L.L.C. at the end of December 2009. On the earnings front however an extraordinary cost was incurred due to a production transfer from a formerBosch plant. As a result operating income stood at ?0.4 billion a turnaroundfrom an operating loss of ?1.1 billion in the previous fiscal year. As of the fiscal2009 year-end the reversal of provision incurred from transfer of business appliedto foreign subsidiaries* was the more-than-expected amount of ?5.9 billion. Thiswas due to the unexpectedly large volume of orders for unprofitable products thatwas included in the business acquisition agreement with Robert Bosch.* “Provision incurred from transfer of business applied to foreign subsidiaries” is recorded under long-term liabilitiesin the consolidated balance sheets as an anticipated operating loss following the completion of the business transferfrom Robert Bosch.● EuropeNet sales grew 5.0% year on year to ?4.4 billion during the fiscal year underreview. The Company recorded an operating loss of ?0.03 billion due to the rawmaterial price hike a turnaround from operating income of ?0.04 billion in theprevious fiscal year.● ChinaOwing to an increase in orders from Japanese automotive manufacturers netsales climbed 42.7% year on year to ?5.1 billion while operating income surged48.8% to ?0.8 billion.● ThailandIn addition to disc brakes the production of brake pads also got on track resultingin a strong increase in orders. Accordingly net sales jumped 41.0% year onyear to ?3.3 billion while operating income skyrocketed 374.6% to ?0.4 billion.● IndonesiaNet sales grew 32.1% from the previous fiscal year to ?14.2 billion and operatingincome increased 58.5% to ?2.5 billion. This was attributable to a favorableincrease in orders from Japanese motorcycle and automotive makers.(Billions of yen) (%)52.356.549.154.632.22007 2008 2009 2010 20112007 2008 2009 2010 201103060(50)050Ratio of operating income (loss) to sales (%)Operating income (loss) (billions of yen)Net income (loss) per share?basic (yen)Net income (loss) (billions of yen)ROE (%)Net assets (Billions of yen)Net equity ratio (%)Total assets (Billions of yen)Net Assets/ROE15.0 13.75.811.6(42.2)(Billions of yen)155.6163.3 164.1186.0155.4Total Assets/Net Equity Ratio(%)30.4 30.517.626.7 25.49(Billions of yen)(20)06(300)03 4080120(Billions of yen)13.94.715.211.4(6.3)2007 2008 2009 2010 20112007 2008 2009 2010 20116.6 6.62.1(16.3)Operating Income (Loss)/Ratio of Operating Income (Loss) to SalesNet Income (Loss)/Net Income (Loss) per Share?Basic(%)(Yen)8.23.6 5.3(3.9)8.061.86 61.8517.805.339.75(151.65)(10)01020(5.0)0.05.010.0010020004080Akebono Brake Industry Co. Ltd. and Consolidated Subsidiaries Years Ended March 31
元のページ