AKEBONO REPORT 2011
21/40
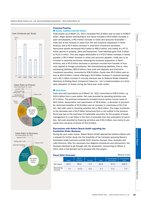
AKEBONO REPORT 2011 Akebono Brake Industry Co. Ltd. 19(Billions of yen)JapanNorthAmerica Europe AsiaConsolidatedeliminationConsolidatedtotalNet sales 93.5 98.0 5.0 20.8 (9.3) 208.0Operatingincome 7.2 (4.0) 0.0 3.7 0.1 7.0Financial Position● Assets Liabilities and Net AssetsTotal assets as of March 31 2011 increased ?21.8 billion year on year to ?186.0billion. Major factors contributing to this result included a ?9.9 billion increase incash and deposits; a ?6.4 billion increase in notes and accounts receivable?trade due to the increase in sales from the new business acquisition in NorthAmerica; and a ?9.5 billion increase in short-term investment securities.Noncurrent assets decreased ?6.0 billion to ?85.0 billion due mainly to a ?7.9billion decline in property plant and equipment. Total liabilities grew ?16.3 billionto ?131.4 billion. This was largely attributable to a ?15.0 billion increase in bondspayable; a ?6.4 billion increase in notes and accounts payable?trade due to anincrease in essential purchases following the business acquisition in NorthAmerica; and a ?5.9 billion decrease in provision incurred from transfer of businessapplied to foreign subsidiaries. Net interest-bearing liabilities that is interest-bearing liabilities (?83.9 billion) less cash and deposits and short-terminvestment securities amounted to ?36.9 billion. Equity rose ?5.5 billion year onyear to ?54.6 billion mainly reflecting a ?3.9 billion increase in retained earningsand a ?2.1 billion increase in minority interests due to Akebono Brake IndustrialMachinery & Rolling Stock Component Sales Co. Ltd.’s implementation of a thirdpartyallocation of shares during the fiscal year under review.● Cash FlowsCash and cash equivalents as of March 31 2011 amounted to ?38.5 billion up?16.9 billion from a year earlier. Net cash provided by operating activities was?7.4 billion. The principal components included income before income taxes of?8.5 billion depreciation and amortization of ?9.8 billion a decrease in provisionfor retirement benefits of ?2.8 billion and an increase in inventories of ?2.2 billion.Net cash used in investing activities fell to ?8.6 billion. The major contributorto the decrease was a ?4.0 billion turnaround from a net outflow in the previousfiscal year due to the purchase of marketable securities for the purpose of assetmanagement to a net inflow in the form of proceeds from the redemption of securities.Net cash provided by financing activities was ?18.2 billion due mainly to proceedsfrom issuance of bonds of ?14.9 billion.Discussions with Robert Bosch GmbH regarding theFoundation Brake BusinessDuring the year under review Robert Bosch GmbH approached akebono Brake witha request for further study into the feasibility of the Company acquiring Bosch’sfoundation brake business outside North America (Europe Asia Australia andLatin America). After the necessary due diligence procedures and discussions theCompany declined to go through with the acquisition announcing on March 4 2011 that it had decided not to proceed with this project.Fiscal 2011 ForecastsSales Ratio by BusinessYear Ended March 31 2011Sales Ratio by ProductYear Ended March 31 2011Automotivedisc brakes34.6%Automotivedrum brakes15.3%Net Sales?216.6billionAutomotivedisc brakepads 18.3%Cornermodules15.8%Components forrolling stock 1.8%Components forindustrial machinery2.3%Sensors 0.8%Others 0.2%Others 0.2%Industrial machinery2.3%Rolling stock 1.8%Sensors 0.8%Rotors2.5%Otherautomotiveparts 8.4%AutomotiveOEM73.3%Net Sales?216.6billionAutomotiveaftermarket21.6%(Yen)6.0 6.010.0 10.05.0 5.02007 2008 2009 2010 2011Cash Dividends per Share0612Feature Social Repor t Environmental Repor t Economic Report Reference MaterialsAkebono Brake Industry Co. Ltd. and Consolidated Subsidiaries Years Ended March 31
元のページ