AKEBONO REPORT 2011
22/40
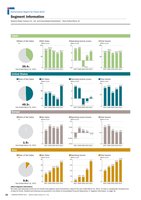
20 AKEBONO REPORT 2011 Akebono Brake Industry Co. Ltd.(%)■Ratio of Net Sales2007 2009 2010 201139.4%Year Ended March 31 2011 2008 2007 2008 2009 2010 2011 2007 2008 2009 2010 20112007 2008 2009 2010 2011 2007 2008 2009 2010 2011 2007 2008 2009 2010 20112007 2008 2009 2010 2011 2007 2008 2009 2010 2011 2007 2008 2009 2010 20112007 2008 2009 2010 2011 2007 2008 2009 2010 2011 2007 2008 2009 2010 2011(Billions of yen)060120■Net Sales(6)0612120.408016098.5(Billions of yen)■Operating Income (Loss)(Billions of yen)■Total Assets(%)■Ratio of Net Sales49.3%Year Ended March 31 2011(Billions of yen)■Net Sales(Billions of yen)■Operating Income (Loss)(Billions of yen)■Total Assets(%)■Ratio of Net Sales1.5%Year Ended March 31 2011(Billions of yen)■Net Sales(Billions of yen)■Operating (Loss) Income(Billions of yen)■Total Assets(%)■Ratio of Net Sales9.8%Year Ended March 31 2011(Billions of yen)■Net Sales(Billions of yen)■Operating Income(Billions of yen)■Total Assets040120804.1(3)036(2.4)40.142.90255029.32.43.2024(0.5)(0.25)00.250.50.15.35.703.574.2012624180.31.002.03.04.00.97.59.907.51595.3101.666.9 69.454.48.99.8(5.1)0.94.8(0.2)(0.0)8.50.215.087.42.9JapanUnited StatesEuropeAsia(1.1)0.437.143.60.0 3.7 3.82.23.7 13.414.835.5106.83.47.115.721.276.785.32.83.3107.4112.710.8110.610.6[About Segment Information]Net sales and operating income do not include inter-segment sales/transactions. Data for the year ended March 31 2011 for Asia is a graphically visualized sumof data for China Thailand and Indonesia as presented in the Notes to Consolidated Financial Statements 5. Segment Information on page 34.Segment InformationAkebono Brake Industry Co. Ltd. and Consolidated Subsidiaries Years Ended March 31Performance Report for Fiscal 2010
元のページ