AKEBONO REPORT 2011
29/40
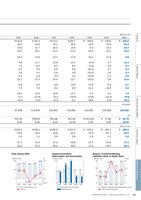
AKEBONO REPORT 2011 Akebono Brake Industry Co. Ltd. 27(15.0)100 5.00 0.0200 10.02007 2008 2009 2010 2011ROA (%)Total assets (billions of yen)(%)Total Assets/ROA(Billions of yen)155.6 163.3 155.4164.1186.0(10.6)3.04.3 4.21.30918Depreciation and amortizationCapital investment2007 2008 2009 2010 2011Capital Investment/Depreciation and Amortization(Billions of yen)9.3 9.9 9.811.48.914.917.85.110.05.40 03060 2.01.090 3.02007 2008 2009 2010 2011Debt on equity ratio (times)Balance of interest-bearing liabilities (billions of yen)(Times)Balance of Interest-BearingLiabilities/Debt on Equity Ratio(Billions of yen)83.943.8 43.179.367.12.91.51.80.9 0.9Billions of yen2005 2006 2007 2008 2009 2010 2011? 132.8 ? 142.3 ? 173.2 ? 184.7 ? 159.6 ? 130.6 ? 216.626.0 30.9 35.1 36.6 14.6 19.8 30.419.6 21.7 20.3 19.8 9.2 15.2 14.016.2 19.1 21.3 21.4 20.9 15.1 19.012.213.512.311.613.111.68.89.8 11.7 13.9 15.2 (6.3) 4.7 11.47.4 8.2 8.0 8.2 (3.9) 3.6 5.35.2 5.9 6.6 6.6 (16.3) 2.1 5.33.9 4.1 3.8 3.6 (10.2) 1.6 2.44.2 4.3 4.3 4.2 (10.6) 1.3 3.021.7 17.2 15.0 13.7 (42.2) 5.8 11.65.8 8.2 8.9 14.9 17.8 5.4 5.17.4 7.6 9.3 9.9 11.4 10.0 9.814.0 12.2 10.8 15.1 4.2 3.2 7.4(3.7) (11.9) (9.1) (16.0) (13.6) (13.4) (8.6)(9.4) (3.2) (3.3) 0.1 38.6 (0.0) 18.2Thousands97 508110 816110 992110 992110 992135 992135 992Yen? 54.29 ? 56.60 ? 61.86 ? 61.85 ? (151.65) ? 17.80 ? 39.756.00 6.00 6.00 10.00 5.00 5.00 10.00Billions of yen? 122.2 ? 150.1 ? 155.6 ? 163.3 ? 155.4 ? 164.1 ? 186.043.0 45.4 43.8 43.1 79.3 67.1 83.91.6 1.1 0.9 0.9 2.9 1.5 1.827.241.047.349.827.443.847.122.3 27.3 30.4 30.5 17.6 26.7 25.4Feature Social Repor t Environmental Repor t Economic Repor t Reference Materials
元のページ