AKEBONO REPORT 2011
34/40
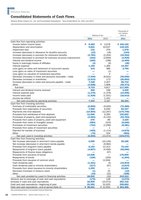
32 AKEBONO REPORT 2011 Akebono Brake Industry Co. Ltd.Consolidated Statements of Cash FlowsAkebono Brake Industry Co. Ltd. and Consolidated Subsidiaries Years Ended March 31 2011 and 2010Millions of YenThousands ofU.S. Dollars(Note 1)2011 2010 2011Cash flow from operating activities:Income before income taxes ? 8 482 ? 2 678 $ 102 192Depreciation and amortization 9 821 10 037 118 325Impairment loss 131 376 1 578Increase (decrease) in allowance for doubtful accounts (12) (18) (144)Increase (decrease) in provision for retirement benefits (2 784) (2 204) (33 542)Increase (decrease) in provision for business structure improvement (410) (2 859) (4 939)Interest and dividend income (200) (198) (2 409)Equity in (earnings) losses of affiliates (3) (9) (36)Interest expense 1 195 1 365 14 397Loss (gain) on sales and retirement of noncurrent assets 315 386 3 795Loss (gain) on sales of investment securities ? (1) ?Loss (gain) on valuation of investment securities ? 4 ?Decrease (increase) in notes and accounts receivable ? trade (7 939) (8 931) (95 650)Decrease (increase) in inventories (2 213) 173 (26 662)Increase (decrease) in notes and accounts payable ? trade 7 448 2 207 89 734Other (4 098) 1 808 (49 373)Sub-total 9 733 4 817 117 265Interest and dividend income received 200 198 2 409Interest expense paid (1 170) (1 378) (14 096)Income taxes paid (1 329) (1 551) (16 012)Income tax refund ? 1 101 ?Net cash provided by operating activities 7 433 3 187 89 554Cash flow from investing activities:Purchase of marketable securities (6 000) (9 000) (72 289)Proceeds from redemption of securities 7 000 6 000 84 337Payments into time deposits (14 504) (12 297) (174 746)Proceeds from withdrawal of time deposits 11 006 9 295 132 602Purchases of property plant and equipment (4 464) (5 152) (53 783)Proceeds from sales of property plant and equipment 276 89 3 325Proceeds from sales of intangible assets (684) (210) (8 240)Purchases of investment securities (704) (1 090) (8 481)Proceeds from sales of investment securities ? 1 ?Payment for transfer of business (405) (1 114) (4 879)Other (75) 104 (903)Net cash used in investing activities (8 555) (13 374) (103 072)Cash flow from financing activities:Net increase (decrease) in short-term loans payable 2 090 (10 146) 25 180Net increase (decrease) in short-term bonds payable ? (9 984) ?Proceeds from long-term loans payable 6 154 12 313 74 144Repayments of long-term loans payable (4 607) (4 490) (55 506)Repayments of finance lease obligations ? (97) ?Proceeds from issuance of bonds 14 928 ? 179 855Repayments of bonds (100) (200) (1 204)Proceeds from issuance of common stock ? 12 656 ?Cash dividends paid (1 321) (4) (15 915)Cash dividends paid to minority shareholders (217) (67) (2 614)Proceeds from stock issuance to minority shareholders 1 295 ? 15 602Decrease (increase) in treasury stock (1) 10 (12)Other (19) (22) (228)Net cash provided by (used in) financing activities 18 203 (32) 219 313Variance due to exchange of cash and cash equivalents: (172) 148 (2 072)Increase in cash and cash equivalents: 16 909 (10 072) 203 722Cash and cash equivalents?beginning of year: 21 552 31 625 259 662Cash and cash equivalents?end of period (Note 4): ? 38 461 ? 21 552 $ 463 385See accompanying Notes to Consolidated Financial Statements.Reference Materials
元のページ