AKEBONO REPORT 2011
36/40
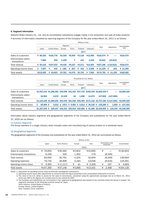
34 AKEBONO REPORT 2011 Akebono Brake Industry Co. Ltd.5. Segment InformationAkebono Brake Industry Co. Ltd. and its consolidated subsidiaries engage mainly in the production and sale of brake products.A summary of information classified by reporting segment of the Company for the year ended March 31 2011 is as follows.Millions of YenSegmentTotal Adjustment ConsolidatedJapan United States Europe China Thailand Indonesia total2011Sales to customers ? 85 253 ?106 778 ?3 328 ?5 099 ?3 130 ?12 985 ?216 574 ? ? ?216 574Intercompany sales/transactions7 882 255 1 108 7 141 1 218 10 612 (10 612) ?Total revenue ? 93 135 ?107 033 ?4 436 ?5 107 ?3 271 ?14 204 ?227 186 ? (10 612) ?216 574Operating income (loss) ? 7 097 ? 416 ? (28) ? 827 ? 416 ? 2 500 ? 11 229 ? 163 ? 11 392Total assets ?112 652 ? 43 603 ?3 761 ?4 475 ?2 703 ? 7 600 ?174 793 ? 11 159 ?185 952Thousands of U.S. DollarsSegmentTotal Adjustment ConsolidatedJapan United States Europe China Thailand Indonesia total2011Sales to customers $1 027 144 $1 286 481 $40 096 $61 433 $37 710 $156 445 $2 609 325 $ ? $2 609 325Intercompany sales/transactions94 963 3 072 13 349 84 1 698 14 674 127 855 (127 855) ?Total revenue $1 122 108 $1 289 554 $53 445 $61 530 $39 409 $171 132 $2 737 180 $ (127 855) $2 609 325Operating income (loss) $ 85 506 $ 5 012 $ (337) $ 9 963 $ 5 012 $ 30 120 $ 135 289 $ 1 963 $ 137 253Total assets $1 357 253 $ 525 337 $45 313 $53 915 $32 566 $ 91 566 $2 105 939 $ 134 445 $2 240 385Information about industry segments and geographical segments of the Company and subsidiaries for the year ended March31 2010 are as follows:(1) Industry SegmentsThe Group operates in a single industry which includes sales and manufacturing of various brakes on a worldwide basis.(2) Geographical SegmentsThe geographical segments of the Company and subsidiaries for the year ended March 31 2010 are summarized as follows:Millions of YenJapan North America Europe Asia Eliminations andCorporate Consolidated2010Sales to customers ? 76 655 ? 35 462 ? 2 822 ? 15 665 ? ? ? 130 604Intercompany transactions 6 439 329 1 402 179 (8 349) ?Total revenue 83 094 35 791 4 224 15 844 (8 349) 130 604Operating expenses 79 730 36 908 4 183 13 636 (8 516) 125 941Operating income (loss) ? 3 365 ? (1 117) ? 41 ? 2 208 ? 167 ? 4 663Total assets ? 107 390 ? 37 146 ? 3 685 ? 13 431 ? 2 468 ? 164 120Notes: 1. Adjustment to operating income (loss) to eliminate intersegment transactions.2. Operating income (loss) after adjustments to reconcile total with figure presented in the consolidated statements of income.3. The value of the U.S. dollar is purely for the sake of convenience calculated using the approximate exchange rate as at March 31 2011 which was ?83 to $1 (figures are rounded down to the nearest $1 000).4. The Company and subsidiaries are summarized in four segments by geographical area based on the countries where the Group is located. Thesegments consisted of the following countries except for Japan.North America: United States of AmericaEurope: France United KingdomAsia: Thailand China Indonesia
元のページ