AKEBONO REPORT 2012
37/68
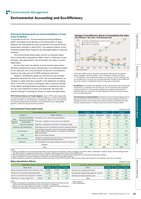
AKEBONO REPORT 2012 Akebono Brake Industry Co. Ltd. 35Enhancing the Manufacturing Process and Recycling Methods to PromoteGreater Eco-EfficiencyIn accordance with the “Environmental Accounting Guidelines2005” formulated by the Ministry of the Environment of Japan Akebono has calculated the costs and effects of its environmentalpreservation activities in fiscal 2011. The economic effects of environmentalpreservation measures are calculated based on concreteevidence.The environmental preservation cost for 11 domestic operationsin fiscal 2011 amounted to ?827 million a 3.6% year on yeardecrease and represented 0.4% of domestic net sales in consolidatedbasis.On the other hand the effects of environmental preservationactivities included year-on-year improvements in eco-efficiency basedon net sales per unit of CO2 emissions as well as in eco-efficiencybased on net sales per unit of PRTR substance emissions.However eco-efficiency based on net sales per unit of wastegeneration declined from 0.61 to 0.59. This was attributable to anincrease in waste sand due to growth in the production of castingparts in line with our policy of raising the ratio of internal manufacturing.Waste sand generated by operations is recycled by contractorsas a raw material for cement and road beds. We have alsostarted working on reducing the volume of waste sand generated.PRTR (Pollutant Release and Transfer Register): Japan’s PRTR system legally obligesbusiness operators handling certain chemical substances to collect and publicallydisclose information on said substances including with regard to the volume generated emitted and transported off premises. This information must be appropriatelygathered verified and reported by those operators.Environmental Preservation Costs (millions of yen)Environmental preservation costs FY2009 FY2010 FY2011Category Major initiatives Investment Costs Investment Costs Investment CostsMainbusinesssegmentPollution prevention Prevention of air water and noise pollution 1 386 41 376 36 352Global environmentalpreservation Prevention of global warming and ozone depletion 0 55 0 56 0 66Resource recycling Reduction disposition and recycle of industrial waste 0 194 0 163 0 174Upstream and downstream Recycling and reuse of products and their packing materials 0 16 0 -5 0 3AdministrativeEnvironmental education and environmental managementsystem (EMS) related activities including the acquiring ofEMS certification0 73 0 74 0 63R&D R&D of eco-friendly products 0 121 0 141 0 120Social activities Initiatives to improve the environment including nature preservation planting and cleaning activities0 15 0 11 0 11Recovery Soil remediation and natural disaster recovery measures 0 0 0 0 0 0Subtotal 1 860 41 817 36 791Total 861 858 827Notes:1. Scope of calculation for environmental preservation costs includes the following 11 bases: Yamagata Fukushima Miharu Tatebayashi Iwatsuki Sanyo ACW (including purchasing) R&D sections (including Proving Grounds) production engineering sections Alocs and the R&D Centre.2. Environmental preservation costs are the amount spent for such activities as operation and maintenance of environment preservation facilities.3. Value of investment is amount invested on introduction of environment preservation facilities.4. Values indicated in subtotal of environmental preservation costs in fiscal 2010 and 2011 differ from the actual sum of costs for the respective years due to rounding.Major Quantitative Effects (millions of yen)Quantitative effects (reduction from the previous year) Economic effects of environmental preservation measuresMajor items FY2009 FY2010 FY2011 Effect FY2009 FY2010 FY2011Global warming prevention (CO2 reduction) t-CO2 -3 200 -4 000 -900 Income from recycling and others 91 75 69Reduction of industrial waste generated t -1 202 -2 151 -1 800 Cost reduction through energy saving VA* and VE** 210 126 317Reduction of industrial waste disposed of in landfills t 0 0 0 Decrease of waste disposal costs 166 177 98Reduction of water usage level 1 000m3 80 30 20 Total 467 378 484Notes:1. Scope of calculation of quantitative effects and economic effects is the same as thatused for environmental preservation costs and includes 11 operations.2. Values with a plus sign indicate a reduction. In addition values have been retroactivelyadjusted accompanying the change in scope of calculation.Eco-efficiency: An indicator that integrates economic performance and environmentalperformance. It is defined as the net sales per unit environmental load imposed bybusiness activities. For this evaluation Akebono has adopted measurements ofindustrial waste CO2 emissions and PRTR substances (emission volume) as indicatorsof environmental load.Environmental Accounting Guidelines: Guidelines for accounting management formulatedby the Ministry of the Environment of Japan aimed at providing a method fordefining the costs of environmental load reduction activities to elucidate their effectivenessand performance. The latest version was issued in February 2005.*From fiscal 2009 scope of calculation includes the following seven productionplants: Yamagata Fukushima Miharu Iwaki Tatebayashi Iwatsuki and Sanyo.** The decrease in the eco-efficiency base on net sales per unit CO2 emissions andthe eco-efficiency of net sales per unit waste generation recorded in fiscal 2009 wasdue to the inclusion of Tatebayashi Foundry in the scope of calculation.1.031.071.281.001.021.03Base unit (fiscal 2004 = 1.00)Changes in Eco-Efficiency Based on Consolidated Net Sales(Eco-efficiency = Net sales / Environmental load)’04 ’06 ’07 (FY)(Benchmark year)’05Net sales/unit PRTR substances (emission volume)Net sales/unit CO2 emissionsNet sales/unit waste generation2.52.01.51.00.51.611.101.00’08 ’09* ’10 ’111.822.182.492.270.96 0.980.91**0.61** 0.61 0.591.100.971.03Special Feature Social Repor t Environmental Repor t Economic Repor t Reference MaterialsEnvironmental Accounting and Eco-EfficiencyEnvironmental Management*Value Analysis**Value Engineering
元のページ