AKEBONO REPORT 2012
46/68
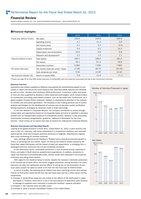
44 AKEBONO REPORT 2012 Akebono Brake Industry Co. Ltd.Financial ReviewAkebono Brake Industry Co. Ltd. and Consolidated Subsidiaries Years Ended March 31Performance Report for the Fiscal Year Ended March 31 2012■Financial Highlights2010 2011 2012Fiscal year (billions of yen): Net sales 130.6 216.6 209.6Operating income 4.7 11.4 3.8Net income (loss) 2.1 5.3 (3.2)Capital investment 5.4 5.1 14.3Depreciation and amortization 10.0 9.8 9.8Research and development* 1.1 1.3 1.7Year-end (billions of yen): Total assets 164.1 186.0 181.0Net assets 49.1 54. 6 49.8Associates (number) 6 984 7 659 7 800Per share data (yen): Net income (loss) per share?basic 17.80 39.75 (24.25)Cash dividends per share 5.00 10.00 10.00Key financial indicator (%): Return on equity (ROE) 5.8 11.6 (7.1)Business OverviewAutomotive disc brakes supplied by Akebono have gained the overwhelming support of customersin Japan and around the world owing to their advanced safety features and reliabilityas well as noise vibration and harshness (NVH) performance. Customers’ safety and peaceof mind are also supported by Akebono’s other advanced technologies which include brakesfor motorcycles and rolling stock-based transport such as the bullet train. Furthermore as aglobal supplier of brake friction materials Akebono is expanding its activities in the marketsfor forklifts and wind power generators. The Company is also making practical use of controlanalysis technologies for the development of sensors and construction quality certificationtesting equipment leveraging its advances made in brake technology.In line with akebono’s Corporate Mission the Company contributes to society throughunique ideas and approaches based on its Corporate Goals and aims to establish a peerlessposition with an indispensable presence in a borderless society. Akebono is also promotingfundamental structural reorganization guided by “akebono’s Declaration for the 21stCentury ” which serves as its stance and code of conduct for realizing the Corporate Mission.Business Environment and Operating ResultsLooking at the global economy in fiscal 2011 ended March 31 2012 a slow recovery wasseen in the U.S. economy with some improvement in employment statistics and corporateperformances while the European economy continued to stagnate reflecting the ongoingdebt crisis confronting EU member countries.Asia although affected by the flooding in Thailand and a slowing of economic growth inChina is still doing well as a whole. Japan hit hard by the extreme losses caused by theGreat East Japan Earthquake and the impact of rapid yen appreciation is emerging from aprolonged economic slump but has not yet completely recovered.In the automotive sector automobile production in Asia remained strong especially inChina and sales in North America outperformed expectations. In addition production inJapan has returned to pre-earthquake levels. Similar trends were observed in the industrialmachinery and rolling stock sectors.With regard to the Akebono Group’s results despite the recovery in domestic productionin the second half of fiscal 2011 the earlier sluggish production among domestic car manufacturersjust after the earthquake and the effects of strong yen on the translation of overseassales caused net sales to shrink 3.2% from the last fiscal year to ?209.6 billion.In terms of profits the following items helped drive down operating income and ordinaryincome to ?3.8 billion (down 66.3% from the last fiscal year) and ?2.1 billion (down 78.5%) respectively:1) Increase in extraordinary expenses due mainly to the effects of the earthquake in Japanand floods in Thailand which led to a rise in the procurement of alternative parts becauseof damage to suppliers and a reduction in production facilities’ capacity utilization2) Increase in raw material costs and labor costs3) Increase in sales of certain unprofitable models in the United States(Billions of yen)060120180240184.7159.6130.6216.6209.62008 2009 2010 2011 2012Net Sales(Million units)05101511.7910.018.86 8.99 9.272008 2009 2010 2011 2012Number of Vehicles Produced in Japan*Please see page 49 for total R&D related expenses including R&D costs and expenses associated with day-to-day improvement activities.
元のページ