AKEBONO REPORT 2012
47/68
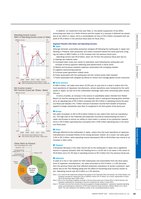
AKEBONO REPORT 2012 Akebono Brake Industry Co. Ltd. 45In addition an impairment loss (see Note 1) the partial suspension of tax effectaccounting (see Note 2) in North America and the impact of a reversal in deferred tax assetsdue to tax reform in Japan led to a consolidated net loss of ?3.2 billion (compared with netprofit of ?5.3 billion in the previous fiscal year) for fiscal 2011.Segment Results (Net Sales and Operating Income)● JapanAlthough domestic automobile production dropped off following the earthquake in Japan andflooding in Thailand both production and orders recovered toward the fiscal year-end bringingnet sales to ?96.2 billion (a 3.2% increase from the previous fiscal year).Operating income was ?5.9 billion down 16.7% from the previous fiscal year due to:1) Soaring raw material costs2) Increased labor costs due mainly to restoration work following the earthquake andincrease of bonus payment reflecting solid performance in fiscal 20103) Market and business research expenses associated with emerging markets4) Logistics restructuring expense5) In-house power generation related costs6) Costs associated with the earthquake and the nuclear power plant disaster7) Costs associated with stepped up efforts to nurture and manage global human resources● North AmericaAt ?96.3 billion net sales were down 10.0% year on year due to a drop in orders from thelocal operations of Japanese manufacturers whose operations were hampered by the earthquakein Japan as well as to the unfavorable exchange rates when converting sales resultsinto yen.In terms of profits an increase in the volume of unprofitable orders inherited from RobertBosch LLC and the soaring cost of the raw materials used in casting and bearing parts contributedto an operating loss of ?5.4 billion compared with ?0.4 billion in operating income the previousfiscal year despite a ?1.7 billion reversal of provision incurred from transfer of businessapplied to foreign subsidiaries (see Note 3) recognized in the first quarter of the fiscal year.● EuropeNet sales increased 11.9% to ?5.0 billion thanks to new orders from local car manufacturers.The high cost of raw materials and expenses incurred by subcontracting out work inJapan and Europe to ensure our ability to meet orders in excess of our production capacityled to a ?0.4 billion operating loss (compared with a ?30 million operating loss in the previousfiscal year).● ChinaAlthough affected by the earthquake in Japan orders from the local operations of Japanesemanufacturers increased thanks to the strong domestic market. As a result net sales grew3.2% to ?5.3 billion while operating income decreased 2.8% to ?0.8 billion due mainly to anincrease in labor costs.● ThailandA temporary decrease in the order volume due to the earthquake in Japan and a significantdecline in capacity utilization after the flooding led to a 13.0% fall in net sales in this sector to?2.8 billion and a 51.3% drop in operating income to ?0.2 billion from the previous fiscal year.● IndonesiaIn spite of a rise in new orders for both motorcycles and automobiles from the local operationsof Japanese manufacturers net sales amounted to ?14.0 billion a 1.6% decreasefrom the previous fiscal year that reflected production slowdowns at certain customers’ operationsdue to the Thai flooding along with the effect of converting local currency results toyen. Operating income was ?2.5 billion (a 1.5% decline).Note 1: As a result of the impairment testing of the assets of the Clarksville Plant (Tennessee the United States) theCompany recorded an impairment loss of US$18.4 million (?1.47 billion). As a result depreciation in fiscal2012 will decrease about US$5 million.Note 2: Due to the recording of negative earnings in the four fiscal years prior to fiscal 2011 in North America theCompany suspended the recording of a portion of deferred tax assets in fiscal 2011.Note 3: “Provision incurred from transfer of business applied to foreign subsidiaries” represents expected operatinglosses accompanying the acquisition of the North American brake business of Robert Bosch LLC in fiscal2010. This was indicated in the liabilities section of the consolidated balance sheets.9(Billions of yen)(20)06(300)03 4080120(Billions of yen)1394.715.211.4(6.3)2008 2009 2010 2011 20122008 2009 2010 2011 2012(3.2)6.62.1(16.3)Operating Income (Loss)/Ratio of Operating Income (Loss) to SalesNet Income (Loss)/Net Income (Loss) per Share?Basic(%)(Yen)8.23.6 5.3(3.9)3.81.8(24.25)61.8517.805.339.75(151.65)(10)01020(5.0)0.05.010.0Sales Ratio by ProductYear Ended March 31 2012Automotivedisc brakes32.8%Automotivedrum brakes15.9%Net Sales?209.6billionAutomotivedisc brakepads 19.0%Cornermodules14.5%Components forrolling stock 1.7%Components forindustrial machinery2.8%Sensors 1.1%Others 0.3%Rotors3.0%Otherautomotiveparts 8.9%Ratio of operating income (loss) to sales (%)Operating income (loss) (billions of yen)Net income (loss) per share?basic (yen)Net income (loss) (billions of yen)Special Feature Social Repor t Environmental Repor t Economic Report Reference Materials
元のページ