AKEBONO REPORT 2012
48/68
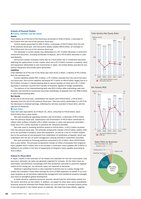
46 AKEBONO REPORT 2012 Akebono Brake Industry Co. Ltd.Analysis of Financial Position● Assets Liabilities and Net AssetsAssetsTotal assets as of the end of the fiscal year amounted to ?181.0 billion a decrease of?4.9 billion from the end of the previous fiscal year.Current assets accounted for ?90.4 billion a decrease of ?10.5 billion from the endof the previous fiscal year and non-current assets totaled ?90.6 billion an increase of?5.6 billion from the end of the previous fiscal year.The decrease in current assets was attributable to a ?7.2 billion decrease in short-terminvestment securities including certificates of deposit and a ?5.6 billion decrease in cashand deposits.Non-current assets increased mainly due to a ?3.6 billion rise in investment securitiesreflecting the appreciation of their market value and a ?1.5 billion increase in property plantand equipment attributable to new investments in Japan the United States and Asia for productionequipment and private power generation.LiabilitiesTotal liabilities as of the end of the fiscal year were ?131.2 billion a decline of ?0.2 billionfrom the previous year.Current liabilities totaled ?67.3 billion a ?7.3 billion increase from the end of the previousfiscal year. Non-current liabilities decreased ?7.5 billion to ?63.9 billion largely due to a?2.6 billion increase in interest-bearing debt to secure liquidity on hand and a ?1.7 billiondecrease in provision incurred from transfer of business applied to foreign subsidiaries.The balance of net interest-bearing debt was ?52.4 billion after subtracting cash anddeposits and short-term investment securities (certificates of deposit) from the ?86.5 billionin total interest-bearing debt.Net AssetsAt the end of the fiscal year consolidated net assets were ?49.8 billion a ?4.8 billiondecrease from the end of the previous fiscal year. This was mainly attributable to a ?4.5 billiondecrease in retained earnings reflecting the net loss recorded in fiscal 2011 and thepayment of dividends.● Cash FlowsCash and cash equivalents as of March 31 2012 amounted to ?18.8 billion down?19.6 billion from a year earlier.Net cash provided by operating activities was ?2.9 billion a decrease of ?4.5 billionfrom the previous fiscal year. Depreciation and amortization of ?9.8 billion contributed toinflows while outflows included a ?4.1 billion increase in notes and accounts receivable?trade and a ?3.1 billion decrease in provision for retirement benefits.Net cash used in investing activities soared to ?23.8 billion a ?15.3 billion increasefrom the previous fiscal year. The principal components include a ?12.9 billion outflow relatedto the purchase of property plant and equipment as well as a net ?7.4 billion outflowdue to the purchase of and proceeds from redemption of certificates of deposit which wasundertaken with the aim of asset management utilizing short-term investment securities.Net cash provided by financing activities amounted to ?1.4 billion down ?16.8 billionfrom a year earlier. The principal components include an inflow of proceeds from long-termloans payable (?12.4 billion) and a net increase in short-term loans payable (?6.3 billion) inaddition to an outflow in the form of repayments of long-term loans payable amounting to?15.5 billion.Outlook for Fiscal 2012In Japan thanks to the extension of tax breaks and subsidies for low fuel consumption cars(eco-cars) domestic car sales are generally expected to increase. On the other hand asautomobile manufacturers increasingly shift their production overseas to avoid the negativeimpact of the strong yen our domestic sales are expected to decrease.Akebono’s operating income is also expected to decline due to a policy change thatentails the Company’s head office bearing the brunt of R&D expenses on behalf of our overseaslocations as we centralize engineering management and intellectual property oversightand move to strengthen global development.In North America a gradual economic recovery should help the automobile market turnthe corner and drive up new orders. In addition we expect to close down some unprofitablebusiness accounts inherited from Robert Bosch LLC and will work to increase product pricesin line with growth in the market prices of materials. We hope that these efforts togetherSales Ratio by BusinessYear Ended March 31 2012Others 0.3%Industrial machinery2.8%Rolling stock 1.7%Sensors 1.1%AutomotiveOEM75.3%Net Sales?209.6billionAutomotiveaftermarket18.8%(Billions of yen) (%)49.856.549.154.632.22008 2009 2010 2011 20122008 2009 2010 2011 201203060(50)050Net Assets/ROE(7.1)13.75.811.6(42.2)(Billions of yen)181.0163.3 164.1186.0155.4Total Assets/Net Equity Ratio(%)23.930.517.626.7 25.4010020004080ROE (%)Net assets (Billions of yen)Net equity ratio (%)Total assets (Billions of yen)
元のページ