AKEBONO REPORT 2012
50/68
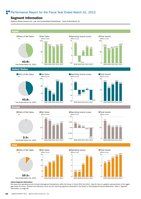
48 AKEBONO REPORT 2012 Akebono Brake Industry Co. Ltd.(%)■Ratio of Net Sales43.8%Year Ended March 31 2012(Billions of yen)2008 2009 2010 2011 2012 2008 2009 2010 2011 2012 2008 2009 2010 2011 20122008 2009 2010 2011 2012 2008 2009 2010 2011 2012 2008 2009 2010 2011 20122008 2009 2010 2011 2012 2008 2009 2010 2011 2012 2008 2009 2010 2011 20122008 2009 2010 2011 2012 2008 2009 2010 2011 2012 2008 2009 2010 2011 2012■Net Sales120.498.5(Billions of yen)■Operating Income (Loss)(Billions of yen)■Total AssetsJapan(%)■Ratio of Net Sales43.8%Year Ended March 31 2012(Billions of yen)■Net Sales4.10.46(1.1)42.929.337.143.639.3(Billions of yen)■Operating Income (Loss)(Billions of yen)■Total AssetsUnited States(%)■Ratio of Net Sales2.3%Year Ended March 31 2012(Billions of yen)6.3■Net Sales0.10.05.74.23.7 3.8 3.7(Billions of yen)■Operating Income (Loss)(Billions of yen)■Total AssetsEurope(%)■Ratio of Net Sales10.1%Year Ended March 31 2012(Billions of yen)10.706121824■Net Sales3.5012340.92.23.79.913.414.815.9(Billions of yen)■Operating Income(Billions of yen)■Total AssetsAsia96.2111.796.370.0107.054.735.85.99.83.47.1(5.1)0.9(5.4)(0.4)(0.0)22.10.215.115.822.694.483.193.15.74.2 4.4107.4112.7128.610.8060120(6)0612080160(6)(3)030255003.57(0.5)(0.25)0.00.250.503.57081604080120(2.4)5.0[About Segment Information]Net sales and operating income include intersegment transactions within the Group. In fiscal 2010 and 2011 data for Asia is a graphic representation of the aggregatetotals for China Thailand and Indonesia which are the reporting segments presented in the Notes to Consolidated Financial Statements Note 5. SegmentInformation on page 60.Segment InformationAkebono Brake Industry Co. Ltd. and Consolidated Subsidiaries Years Ended March 31Performance Report for the Fiscal Year Ended March 31 2012
元のページ