AKEBONO REPORT 2012
55/68
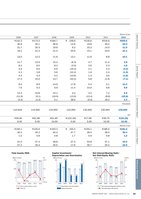
AKEBONO REPORT 2012 Akebono Brake Industry Co. Ltd. 53(15.0)100 5.00 0.0200 10.02008 2009 2010 2011 2012ROA (%)Total assets (billions of yen)(%)Total Assets/ROA(Billions of yen)163.3 155.4164.1186.0 181.0(10.6)1.34.23.0(1.8)0918Depreciation and amortizationCapital investment2008 2009 2010 2011 2012Capital Investment/Depreciation and Amortization(Billions of yen)9.9 9.8 9.811.414.917.85.114.310.05.40 02040 2.01.060 3.02008 2009 2010 2011 2012Net debt-equity ratio (times)Net interest-bearing debt (billions of yen)(Times)Net Interest-Bearing Debt/Net Debt-Equity Ratio(Billions of yen)47.752.436.940.2 39.50.81.70.9 0.81.2Billions of yen2006 2007 2008 2009 2010 2011 2012? 142.3 ? 173.2 ? 184.7 ? 159.6 ?130.6 ?216.6 ?209.630.9 35.1 36.6 14.6 19.8 30.4 24.921.7 20.3 19.8 9.2 15.2 14.0 11.919.1 21.3 21.4 20.9 15.1 19.0 21.113.512.311.613.111.68.810.111.7 13.9 15.2 (6.3) 4.7 11.4 3.88.2 8.0 8.2 (3.9) 3.6 5.3 1.85.9 6.6 6.6 (16.3) 2.1 5.3 (3.2)4.1 3.8 3.6 (10.2) 1.6 2.4 (1.5)4.3 4.3 4.2 (10.6) 1.3 3.0 (1.8)17.2 15.0 13.7 (42.2) 5.8 11.6 (7.1)8.2 8.9 14.9 17.8 5.4 5.1 14.37.6 9.3 9.9 11.4 10.0 9.8 9.812.2 10.8 15.1 4.2 3.2 7.4 2.9(11.9) (9.1) (16.0) (13.6) (13.4) (8.6) (23.8)(3.2) (3.3) 0.1 38.6 (0.0) 18.2 1.4Thousands110 816110 992110 992110 992135 992135 992135 992Yen? 56.60 ? 61.86 ? 61.85 ? (151.65) ? 17.80 ? 39.75 ?(24.25)6.00 6.00 10.00 5.00 5.00 10.00 10.00Billions of yen? 150.1 ? 155.6 ? 163.3 ? 155.4 ? 164.1 ? 186.0 ?181.040.3 40.2 40.2 47.7 39.5 36.9 52.41.0 0.8 0.8 1.7 0.9 0.8 1.241.047.349.827.443.847.143.327.3 30.4 30.5 17.6 26.7 25.4 23.9Special Feature Social Repor t Environmental Repor t Economic Repor t Reference Materials
元のページ