AKEBONO REPORT 2012
60/68
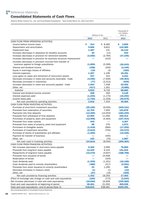
58 AKEBONO REPORT 2012 Akebono Brake Industry Co. Ltd.Consolidated Statements of Cash FlowsAkebono Brake Industry Co. Ltd. and Consolidated Subsidiaries Years Ended March 31 2012 and 2011Millions of YenThousands ofU.S. Dollars(Note 1)2012 2011 2012CASH FLOW FROM OPERATING ACTIVITIES:Income before income taxes ? 314 ? 8 482 $ 3 829Depreciation and amortization 9 806 9 821 119 585Impairment loss 1 487 131 18 134Increase (decrease) in allowance for doubtful accounts 20 (12) 243Increase (decrease) in provision for retirement benefits (3 050) (2 784) (37 195)Increase (decrease) in provision for business structure improvement ? (410) ?Increase (decrease) in provision incurred from transfer ofbusiness applied to foreign subsidiaries(1 660)(5 399)(20 243)Interest and dividend income (258) (200) (3 146)Equity in (earnings) losses of affiliates (15) (3) (182)Interest expenses 1 267 1 195 15 451Loss (gain) on sales and retirement of noncurrent assets 347 315 4 231Decrease (increase) in notes and accounts receivable - trade (4 056) (7 939) (49 463)Decrease (increase) in inventories (77) (2 213) (939)Increase (decrease) in notes and accounts payable - trade 1 924 7 448 23 463Other net (417) 1 301 (5 085)Subtotal 5 632 9 733 68 682Interest and dividend income received 258 200 3 146Interest expenses paid (1 254) (1 170) (15 292)Income taxes paid (1 720) (1 329) (20 975)Net cash provided by operating activities 2 916 7 433 35 560CASH FLOW FROM INVESTING ACTIVITIES:Purchase of short-term investment securities (20 100) (6 000) (245 121)Proceeds from redemption of securities 12 700 7 000 154 878Payments into time deposits (13 300) (14 504) (162 195)Proceeds from withdrawal of time deposits 13 900 11 006 169 512Purchases of property plant and equipment (12 908) (4 464) (157 414)Proceeds from state subsidy 345 ? 4 207Proceeds from sales of property plant and equipment 88 276 1 073Purchases of intangible assets (1 418) (684) (17 292)Purchases of investment securities (2 015) (704) (24 573)Purchase of stocks of subsidiaries and affiliates (1 265) ? (15 426)Payment for transfer of business ? (405) ?Other net 163 (75) 1 987Net cash used in investing activities (23 810) (8 555) (290 365)CASH FLOW FROM FINANCING ACTIVITIES:Net increase (decrease) in short-term loans payable 6 303 2 090 76 865Proceeds from long-term loans payable 12 425 6 154 151 524Repayments of long-term loans payable (15 479) (4 607) (188 768)Proceeds from issuance of bonds ? 14 928 ?Redemption of bonds ? (100) ?Cash dividends paid (1 325) (1 321) (16 158)Cash dividends paid to minority shareholders (488) (217) (5 951)Proceeds from stock issuance to minority shareholders 23 1 295 280Decrease (increase) in treasury stock (1) (1) (12)Other net (27) (19) (329)Net cash provided by financing activities 1 432 18 203 17 463Effect of exchange rate change on cash and cash equivalents (184) (172) (2 243)Net increase (decrease) in cash and cash equivalents (19 646) 16 909 (239 585)Cash and cash equivalents at beginning of period 38 461 21 552 469 036Cash and cash equivalents?end of period (Note 3) ?18 815 ?38 461 $229 451See accompanying Notes to Consolidated Financial Statements.Reference Materials
元のページ