AKEBONO REPORT 2012
62/68
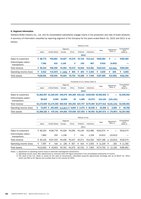
60 AKEBONO REPORT 2012 Akebono Brake Industry Co. Ltd.5. Segment InformationAkebono Brake Industry Co. Ltd. and its consolidated subsidiaries engage mainly in the production and sale of brake products.A summary of information classified by reporting segment of the Company for the years ended March 31 2012 and 2011 is asfollows.Millions of YenSegmentTotal Adjustment(Note 1)ConsolidatedtotalJapan United States Europe China Thailand Indonesia (Note 2)2012Sales to customers ? 88 773 ?95 883 ?3 827 ?5 270 ?2 716 ?13 114 ?209 584 ? ? ?209 584Intercompany sales/transactions7 381 415 1 136 2 130 867 9 932 (9 932) ?Total revenue ? 96 154 ?96 298 ?4 964 ?5 272 ?2 846 ?13 981 ?219 515 ?(9 932) ?209 584Operating income (loss) ? 5 912 ? (5 357) ? (395) ? 804 ? 203 ? 2 463 ? 3 630 ? 205 ? 3 835Total assets ?128 591 ?39 306 ?3 664 ?5 794 ?2 288 ? 7 946 ?187 589 ?(6 559) ?181 030Thousands of U.S. Dollars (Note 3)SegmentTotal Adjustment(Note 1)ConsolidatedtotalJapan United States Europe China Thailand Indonesia (Note 2)2012Sales to customers $1 082 597 $1 169 304 $46 670 $64 268 $33 121 $159 926 $2 555 902 $ ? $2 555 902Intercompany sales/transactions90 012 5 060 13 853 24 1 585 10 573 121 121 (121 121) ?Total revenue $1 172 609 $1 174 365 $60 536 $64 292 $34 707 $170 500 $2 677 012 $(121 121) $2 555 902Operating income (loss) $ 72 097 $ (65 329) $ (4 817) $ 9 804 $ 2 475 $ 30 036 $ 44 268 $ 2 500 $ 46 768Total assets $1 568 182 $ 479 341 $44 682 $70 658 $27 902 $ 96 902 $2 287 671 $ (79 987) $2 207 682Millions of YenSegmentTotal Adjustment(Note 1)ConsolidatedtotalJapan United States Europe China Thailand Indonesia (Note 2)2011Sales to customers ? 85 253 ?106 778 ?3 328 ?5 099 ?3 130 ?12 985 ?216 574 ? ? ?216 574Intercompany sales/transactions7 882 255 1 108 7 141 1 218 10 612 (10 612) ?Total revenue ? 93 135 ?107 033 ?4 436 ?5 107 ?3 271 ?14 204 ?227 186 ? (10 612) ?216 574Operating income (loss) ? 7 097 ? 416 ? (28) ? 827 ? 416 ? 2 500 ? 11 229 ? 163 ? 11 392Total assets ?112 652 ? 43 603 ?3 761 ?4 475 ?2 703 ? 7 600 ?174 793 ? 11 159 ?185 952Notes: 1. Adjustment to operating income (loss) to eliminate intersegment transactions.2. Operating income (loss) after adjustments to reconcile total with figure presented in the consolidated statements of income.3. The value of the U.S. dollar is purely for the sake of convenience calculated using the approximate exchange rate as at March 31 2012 which was ?82 to $1 (figures are rounded down to the nearest $1 000).
元のページ