AKEBONO REPORT 2013
34/72
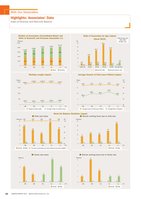
● Family care leave ● Shor ter working hours due to family care(Persons)(Persons)(FY)Female MaleWork-Life Balance Statistics (Japan)’08 ’09 ’10 ’11 ’1202,0004,0006,0008,00010,0007,659 7,8006,9846,40557% 57%43% 53%43%8,27960%57% 47% 43% 40%’08 ’09 ’10 ’11 ’1205001,0001,5002,0001,918.7 1,915.8 1,915.51,803.7204.81,830.7192.4 166.4 205.4 218.9’08 ’09 ’10 ’11 ’120510152025231611151901 101’08 ’09 ’10 ’11 ’1205101520251422101181 1 1 10051015202530’08 ’09 ’10 ’11 ’1201230 0 012 2310 0’08 ’09 ’10 ’11 ’12012340241 1010 0 0’08 ’09 ’10 ’11 ’12(Hours) (Days) (%)0510152080859095100(%)8085909510017.3 17.2 17.6 16.8100 100 100 100 10091.316.688.189.6 89.186.90.221.828.120.013.02.94.61.52.4 3.0 2.60.0Number of Associates (Consolidated Basis) andRatio of Domestic and Overseas Associates (%)Ratio of Associates by Age (Japan)(fiscal 2012)(Persons) (%)(Persons)Workday Length (Japan) Average Amount of Paid Leave Utilized (Japan)(FY)(FY)Regular workday length Average number of overtime hoursThe ratio of associates who take childcare leave after childbirth(FY)Average Amount of Paid Leave Utilized Average Rate of UtilizationMale-female ratioMale: 89%Female: 11%With Our AssociatesHighlights: Associates’ DataIndex of Diversity and Work-Life Balance
元のページ