AKEBONO REPORT 2013
39/72
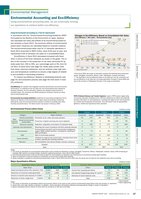
Environmental Preservation Costs (millions of yen)Environmental preservation costs FY2010 FY2011 FY2012Category Major initiatives Investment Costs Investment Costs Investment CostsMainbusinesssegmentPollution prevention Prevention of air, water and noise pollution 41 376 36 352 37 241Global environmentalpreservation Prevention of global warming and ozone depletion 0 56 0 66 145 84Resource recycling Reduction, disposition and recycle of industrial waste 0 163 0 174 0 186Upstream and downstream Recycling and reuse of products and their packing materials 0 -5 0 3 0 -3AdministrativeEnvironmental education and environmental managementsystem (EMS) related activities, including the acquiring ofEMS certification0 74 0 63 0 46R&D R&D of eco-friendly products 0 141 0 120 0 78Social activities Initiatives to improve the environment, including nature preservation,planting and cleaning activities0 11 0 11 0 8Recovery Soil remediation and natural disaster recovery measures 0 0 0 0 0 0Subtotal 41 817 36 791 182 640Total 858 827 822Notes:1. The scope of calculation for environmental preservation costs includes the following 11 bases: Yamagata, Fukushima, Miharu, Tatebayashi, Iwatsuki, Sanyo, ACW (including purchasing),R&D sections (including Ai-Ring), production engineering sections, Alocs and the R&D Centre.2. Environmental preservation costs are the amount spent for such activities as operation and maintenance of environment preservation facilities.3. Value of investment is amount invested on introduction of environment preservation facilities.4. Values indicated in subtotal of environmental preservation costs in fiscal 2010 and 2011 differ from the actual sum of costs for the respective years due to rounding.Major Quantitative Effects (millions of yen)Quantitative effects (reduction from the previous year) Economic effects of environmental preservation measuresMajor items FY2010 FY2011 FY2012 Effect FY2010 FY2011 FY2012Global warming prevention (CO2 reduction) t-CO2 -4,000 -900 -1,900 Income from recycling and others 75 69 68Reduction of industrial waste generated t -2,151 -1,800 -3,100 Cost reduction through energy saving, VA* and VE** 126 317 162Reduction of industrial waste disposed of in landfills t 0 0 0 Decrease of waste disposal costs 177 98 71Reduction of water usage level 1,000m3 30 20 0 Total 378 484 302Notes:1. The scope of calculation of quantitative effects and economic effects is the same as that used for environmental preservation costs and includes 11 operations.2. Values with a plus sign indicate a reduction. In addition, values have been retroactively adjusted accompanying the change in scope of calculation.3. Figures indicating economic effects for fiscal 2012 do not add up to 302 due to rounding.*From fiscal 2009, the scope of calculation includes the following seven productionplants: Yamagata, Fukushima, Miharu, Iwaki, Tatebayashi, Iwatsuki and Sanyo.** The decrease in the eco-efficiency base on net sales per unit CO2 emissions andthe eco-efficiency of net sales per unit waste generation recorded in fiscal 2009 wasdue to the inclusion of Tatebayashi Foundry in the scope of calculation.Base unit (fiscal 2004 = 1.00)Changes in Eco-Efficiency Based on Consolidated Net Sales(Eco-efficiency = Net sales / Environmental load)’04 ’06 ’07 (FY)(Benchmark year)’05Net sales/unit PRTR substances (emission volume)Net sales/unit CO2 emissionsNet sales/unit waste generation2.52.01.51.00.5’08 ’09* ’10 ’11 ’121.031.071.281.001.021.031.611.101.001.822.182.49 2.442.270.91** 0.96 0.98 0.920.610.59 0.53 0.61**1.100.971.03*Value Analysis**Value EngineeringEnvironmental ManagementEnvironmental Accounting and Eco-EfficiencyUsing environmental accounting data, we are continually revisingour operations to achieve better eco-efficiency.Using Environmental Accounting as a Tool for ImprovementIn accordance with the “Environmental Accounting Guidelines 2005”formulated by the Ministry of the Environment of Japan, Akebonohas calculated the costs and effects of its environmental preservationactivities in fiscal 2012. The economic effects of environmentalpreservation measures are calculated based on concrete evidence.The environmental preservation cost for 11 domestic operations infiscal 2012 amounted to ?822 million, down 6.0% year on year, andrepresented 0.9% of domestic net sales on a consolidated basis.Eco-efficiency in fiscal 2012 decreased compared with fiscal2011 in terms of the three indicators as shown in the graph. This isdue to the increase in the proportion of net sales accounted for bybrake pads from 19% to 20%, up 1 percentage point or 5%, from fiscal2011 to fiscal 2012 (see page 53). Brake pads contain morethan dozen chemical substances, and are sintered under high pressureand temperature conditions to ensure a high degree of reliabilityand durability in demanding situations.To improve eco-efficiency, Akebono is developing products (seepage 41) and production process (see page 45) that result in lowerCO2 emissions.Eco-efficiency: An indicator that integrates economic performance and environmentalperformance. It is defined as the net sales per unit environmental load imposed bybusiness activities. For this evaluation, Akebono has adopted measurements ofindustrial waste, CO2 emissions and PRTR substances (emission volume) as indicatorsof environmental load.Environmental Accounting Guidelines: Guidelines for accounting management formulatedby the Ministry of the Environment of Japan aimed at providing a method fordefining the costs of environmental load reduction activities to elucidate their effectivenessand performance. The latest version was issued in February 2005.PRTR (Pollutant Release and Transfer Register): Japan’s PRTR system legally obligesbusiness operators handling certain chemical substances to collect and publicallydisclose information on said substances, including with regard to the volume generated,emitted and transported off premises. This information must be appropriatelygathered, verified and reported by those operators.
元のページ