AKEBONO REPORT 2013
40/72
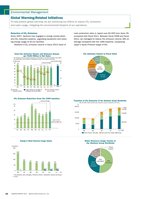
Reduction of CO2 EmissionsSince 2007, Akebono has engaged in energy conservationand CO2 reduction projects, upgrading equipment and reducingenergy usage at all our facilities.Akebono’s CO2 emission volume in fiscal 2012 (total ofmain production sites in Japan) was 62,000 tons down 3%compared with fiscal 2011. Between fiscal 2008 and fiscal2012, we managed to reduce the emission volume 18% onaverage compared with the 1990 baseline, surpassingJapan’s Kyoto Protocol target of 6%.(t)’08’90 ’05 ’06 ’07 ’08 ’09 ’10 ’11 ’12’09 ’10 ’11 ’127465 665963 63 64 62 6169Five-year average010203040506070805060708070.867.4 66.5163,10062,00035,3001,62062.860.559.1 59.171.0*5669.3070,000140,000210,000280,000Total CO2 Emission Volume and Emission Volumeper ?100 Million in Net Sales(FY)(1,000 tons)CO2 emission volumeper unit salesThe increase in the CO2 emission volume per ¥100 million in net sales recorded in fiscal 2009was attributable to the inclusion of Tatebayashi Foundry in the scope of calculation.(tons/?100 million)Target (reduce an average 7%compared with fiscal 1990)Total CO2emission volumeTransition of CO2 Emissions of the Akebono Group Worldwide(Year)North America Japan Asia (other than Japan) EuropeAEC and ABC in North America were included in scope of calculation from 2011.TargetCO2 Emission Reduction (from the 1990 baseline)’04 ’05 ’06 ’07 ’08 ’09 ’11 ’12 (FY)(%)11 12 11152015141618Five-year average051015202525Japan’s KyotoProtocol Target: 6%(t)’08’90 ’05 ’06 ’07 ’08 ’09 ’10 ’11 ’12’09 ’10 ’11 ’127465 665963 63 64 62 6169Five-year average010203040506070805060708070.867.4 66.5163,10062,00035,3001,62062.860.559.1 59.171.0*5669.3070,000140,000210,000280,000Total CO2 Emission Volume and Emission Volumeper ?100 Million in Net Sales(FY)(1,000 tons)CO2 emission volumeper unit salesThe increase in the CO2 emission volume per ¥100 million in net sales recorded in fiscal 2009was attributable to the inclusion of Tatebayashi Foundry in the scope of calculation.(tons/?100 million)Target (reduce an average 7%compared with fiscal 1990)Total CO2emission volumeTransition of CO2 Emissions of the Akebono Group Worldwide(Year)North America Japan Asia (other than Japan) EuropeAEC and ABC in North America were included in scope of calculation from 2011.TargetCO2 Emission Volume in Fiscal 2012Yamagata20,400tIwatsuki15,200tTotal62,000tTatebayashi10,100tFukushima9,400tSanyo6,900tWater Resource Usage Volume ofthe Akebono Group WorldwideJapanNorth 720,000m3America440,000m3Asia(other than Japan)230,000m3Total1,395,000m3Europe5,000m3’95 ’07 ’08 ’09 ’10 ’11 ’121548577(10,000m3)Change in Water Resource Usage Volume69 668**648**657**(FY)050100150200* Six production sites (Yamagata, Fukushima, Miharu, Tatebayashi, Iwatsuki and Sanyo)** Ai-CityEnvironmental ManagementGlobal Warming-Related InitiativesTo help prevent global warming, we are continuing our efforts to reduce CO2 emissionsand water usage, mitigating the environmental footprint of our operations.
元のページ