AKEBONO REPORT 2013
42/72
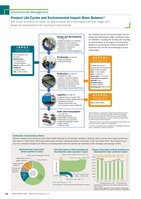
●MSDS evaluations of materials●Response to ELV directive●Reduction of environmentallyhazardous substances●Reduction of VOCs●Response to REACH regulationsSales and Consumption● Implementation of modal shift● Adopting recyclable shipping materials●Response to revisedEnergy Conservation Law●CO2 emission volume 3,268 tons(see page 46)●Recycling activities● Information on end-users● Information on customers● Legal and regulatory trends●Social trends● Industry trends● Initiatives for 3Rs(reduce, reuse and recycle)●Reduction of CO2 emission●Pursuance of zero-emissions●Reduction of industrial waste●Promotion of ISO 14001●CO2 emission volume 62,000 tons[Emitted, recycled andpumped into the atmosphere]CO2: 62,000t (63,900t)NOx**: 47.9t (38.8t)SOx**: 1.8t (1.2t)Smoke dust**: 1.2t (0.3t)Final volume of waste fordisposal: 0t (0t)Recycled volume:30,500t (33,600t)Recycling rate: 100% (100%)[Purchased power andfuel used]Electric power:117,000,000kWh(123,000,000kWh)Fuel oil: 1,700kl (1,200kl)Heating oil:2,700kl (3,100kl)LPG: 1,900t (2,000t)Production (see page 45)Logistics (see page 46)Design and Development(see page 41)●Green purchasing●CSR procurementPurchasing (see page 44)I N P U TO U T P U TCO2: 3,268t (3,494t)O U T P U TParentheses indicatefiscal 2011 valuesParentheses indicatefiscal 2011 valuesParentheses indicatefiscal 2011 valuesOur initiatives for the environment begin with thedesign and development stage, covering all stagesthereafter, including the recovery and recyclingof used products. In all aspects of its business,Akebono is practicing the effective utilization ofresources with the aim of contributing to a recyclingsociety.*Mass balance is a quantitative balance that represents the balanceof resources consumed and waste emitted (including gas,smoke dust, etc.) during the entire life cycle of a given material,from generation through use, emission, recovery, recycling and reuseafter recycling to final disposal.**Values for NOx, SOx and smoke dust represent total emission volumesfrom facilities subject to the regulations***Scope of calculation covers operations in Yamagata, Fukushima,Miharu, Tatebayashi, Iwatsuki and SanyoWaste Generated in Fiscal 2012(primary operations in Japan)Metal19,000t62%Volumegenerated30,500tFriction materials2,600t 9%Sludge 800t 3%Oil waste andwaste fluid2,800t 9%Slag4,600t15%Waste plastic 200t 1%Paper, wood and cardboard 100t 0%Others 400t 1%Fiscal 2012 Volume of Waste Generated andRecycling Ratio (major operations in Japan)33,600tChange in Total Volume of Waste Generated andRecycling Ratio (major operations in Japan)Total volume of waste generated includes resources of value,such as metals.Reused within production process 500t 2%direct landfill disposal 0t 0%Values represent aggregation of eight operations. TatebayashiFoundry was included in the scope of calculations in fiscal 2009.Since fiscal 2007, we eliminated direct landfill disposal completely.Recycled using alternativemethod 10,100t 30%Resources of value 19,000t 62%Thermally recycled 900t 3%Volume generated30,500tTotal generated volume Recycling ratio99.8(%) 100(%) 100(%) 100(%) 100(%) 100(%) 100(%)’06 ’07 ’08 ’09 ’10 ’11 ’12(t) (%)(FY)88899091929394959697989910034,76537,47628,44729,64931,80033,60030,50005,00010,00015,00020,00025,00030,00035,00040,000Continuation of Zero-Emission EffortsAkebono achieved zero emissions (zero direct landfill disposal) at all domestic facilities in February 2007 and has since been maintainingthat status. In fiscal 2012, the Group’s total waste emission volume decreased 3,100 tons, or 9%, from fiscal 2011. We continue to pursuezero emissions through such efforts as recycling waste sand into cement raw materials, which we began outsourcing in 2010.Environmental ManagementProduct Life Cycles and Environmental Impact Mass Balance*With an eye on product life cycles, we seek to reduce the environmental load at all stages fromdesign and development to the recycling of used products.
元のページ