AKEBONO REPORT 2013
52/72
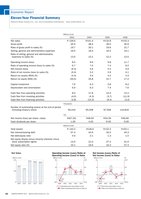
Net Sales(Billions of yen)2009 2010 2011 2012 2013159.6216.6 209.6 206.0130.6(10)0.0(5.0)10 5.0020 10.0Ratio of operating income (loss) to sales (%)Operating income (loss) (billions of yen)(%)2009 2010 2011 2012 2013Operating Income (Loss)/Ratio ofOperating Income (Loss) to Sales(Billions of yen)(6.3)11.43.8 4.31.8 2.13.6 5.34.7(3.9)(20) (20.0)5 5.00 0.010 10.02009 2010 2011 2012 2013Ratio of net income (loss) to sales (%)Net income (loss) (billions of yen)(%)Net Income (Loss)/Ratio ofNet Income (Loss) to Sales(Billions of yen)(3.2)0.52.1(16.3)1.62.40.35.3(10.2) (1.5)Billions of yen 2003 2004 2005 2006 Net sales ? 126.6 ? 141.4 ? 132.8 ? 142.3 Gross profit 25.0 28.4 26.0 30.9 Ratio of gross profit to sales (%) 19.7 20.1 19.6 21.7 Selling, general and administrative expenses 16.5 18.4 16.2 19.1 Ratio of selling, general and administrativeexpenses to sales (%)13.013.112.213.5Operating income (loss) 8.5 9.9 9.8 11.7 Ratio of operating income (loss) to sales (%) 6.7 7.0 7.4 8.2 Net income (loss) (6.3) 4.6 5.2 5.9 Ratio of net income (loss) to sales (%) (5.0) 3.2 3.9 4.1 Return on assets (ROA) (%) (4.4) 3.4 4.2 4.3 Return on equity (ROE) (%) (35.5) 25.8 21.7 17.2 Capital investment 7.6 6.3 5.8 8.2 Depreciation and amortization 6.9 6.3 7.4 7.6 Cash flow from operating activities 8.0 17.8 14.0 12.2 Cash flow from investing activities (4.0) (4.3) (3.7) (11.9) Cash flow from financing activities (2.8) (13.3) (9.4) (3.2) Thousands Number of outstanding shares at the end of period(including treasury stock)94,01995,50897,508110,816Yen Net income (loss) per share?basic ? (67.25) ?48.50 ? 54.29 ? 56.60 Cash dividends per share 1.00 4.00 6.00 6.00 Billions of yen Total assets ? 143.2 ?126.6 ? 122.2 ? 150.1 Net interest-bearing debt 57.4 44.9 35.5 40.3 Net debt-equity ratio 4.0 2.1 1.3 1.0 Net equity (Equity minus minority interests minusstock subscription rights)14.521.027.241.0Net equity ratio (%) 10.1 16.6 22.3 27.3 Economic ReportEleven-Year Financial SummaryAkebono Brake Industry Co., Ltd. and Consolidated Subsidiaries Years ended March 31
元のページ