AKEBONO REPORT 2013
53/72
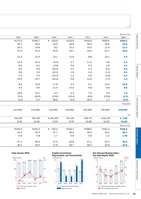
15.0)100 5.00 0.0200 10.02009 2010 2011 2012 2013ROA (%)Total assets (billions of yen)(%)Total Assets/ROA(Billions of yen)186.6155.4164.1186.0 181.0(10.2)1.30.33.0(1.8)02010Depreciation and amortizationCapital investment2009 2010 2011 2012 2013Capital Investment/Depreciation and Amortization(Billions of yen)9.8 9.811.417.85.114.319.88.610.05.40 02550 2.01.075 3.02009 2010 2011 2012 2013Net debt-equity ratio (times)Net interest-bearing debt (billions of yen)(Times)Net Interest-Bearing Debt/Net Debt-Equity Ratio(Billions of yen)47.752.468.136.939.5 1.461.70.9 0.81.2Billions of yen2007 2008 2009 2010 2011 2012 2013? 173.2 ? 184.7 ? 159.6 ?130.6 ?216.6 ?209.6 ?206.035.1 36.6 14.6 19.8 30.4 24.9 23.520.3 19.8 9.2 15.2 14.0 11.9 11.421.3 21.4 20.9 15.1 19.0 21.1 19.212.311.613.111.68.810.19.313.9 15.2 (6.3) 4.7 11.4 3.8 4.38.0 8.2 (3.9) 3.6 5.3 1.8 2.16.6 6.6 (16.3) 2.1 5.3 (3.2) 0.53.8 3.6 (10.2) 1.6 2.4 (1.5) 0.34.3 4.2 (10.2) 1.3 3.0 (1.8) 0.315.0 13.7 (42.2) 5.8 11.6 (7.1) 1.28.9 14.9 17.8 5.4 5.1 14.3 19.89.3 9.9 11.4 10.0 9.8 9.8 8.610.8 15.1 4.2 3.2 7.4 2.9 7.6(9.1) (16.0) (13.6) (13.4) (8.6) (23.8) (4.1)(3.3) 0.1 38.6 (0.0) 18.2 1.4 (2.0)Thousands110,992110,992110,992135,992135,992135,992135,992Yen? 61.86 ? 61.85 ? (151.65) ? 17.80 ? 39.75 ? (24.25) ? 3.906.00 10.00 5.00 5.00 10.00 10.00 10.00Billions of yen? 155.6 ? 163.3 ? 155.4 ? 164.1 ? 186.0 ? 181.0 ?186.640.2 40.2 47.7 39.5 36.9 52.4 68.10.8 0.8 1.7 0.9 0.8 1.2 1.4647.349.827.443.847.143.346.530.4 30.5 17.6 26.7 25.4 23.9 24.9
元のページ