AKEBONO REPORT 2013
55/72
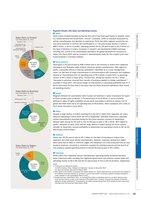
Segment Results (Net Sales and Operating Income)● JapanWhile orders trended favorably during the first half of the fiscal year thanks to disaster recoveryrelated demand and Government “eco-car” subsidies, shifts to overseas production byvehicle manufacturers and declines in exports (to China and other regions) caused the serviceparts business to contract and contributed to a 7.0% year-on-year decline in sales to?89.5 billion. In terms of profits, operating income fell 61.2% year-on-year to ?2.3 billion onthe back of declines in orders, increases in research and development (R&D) expensesresulting from a shift of the consolidated operations for global development functions toJapan from fiscal 2012 and an increase in developmental costs for new models to be introducedprimarily in overseas markets.● North AmericaSales grew 2.2% year-on-year to ?98.4 billion due to the recovery in orders from Japanesetransplants and favorable sales of North American vehicle manufacturers. With regard toprofits, successful efforts to improve profitability?identified as a crucial managementissue?on the back of major improvements in communications with customers and suppliersallowed an improvement from an operating loss of ?5.4 billion in fiscal 2011 to operatingincome of ?0.1 billion in fiscal 2012. Furthermore, taking into account the ?1.7 billion“decrease in provision incurred from transfer of business applied to foreign subsidiaries”2recorded in fiscal 2011, the actual margin of improvement in operating profitability was ?7.2billion and marks the first time in five years that our North American operations have recordedoperating income.3● EuropeStagnant demand for automobiles within Europe and declines in sales of products for exportto China caused sales to decline 1.7% year-on-year to ?4.9 billion. In terms of profits,declines in sales of highly profitable service parts and delays in efforts to reduce cost ofgoods and fixed costs led to an operating loss of ?0.8 billion, which compares with a loss of?0.4 billion recorded in fiscal 2011.● ChinaDespite a large decline in orders resulting from the fall in orders from Japanese car manufacturersoperating in China since the end of September, favorable orders from Japanesevehicle manufacturers recorded during the first three quarters (January to September)allowed sales during the full year to rise 14.9% year-on-year to ?6.1 billion. With regard toprofits, increases in labor costs and the large decline in orders during the fourth quarter(October to December) caused profitability to deteriorate and operating income to fall 42.3%year-on-year to ?0.5 billion.● ThailandSales rose 78.2% year-on-year to ?5.1 billion on the back of increases in orders fromJapanese and other local vehicle manufacturers. However, expenses arising from higherlabor costs due to hikes in minimum wages, the installment of a new production line for newproducts (pistons), increases in production capacity for existing products and the launch ofnew products caused operating income to fall 26.4% year-on-year to ?0.1 billion.● IndonesiaWhile orders from Japanese vehicle manufacturers operating locally remained favorable,weak motorcycle sales resulting from tightened government loan policies caused sales andoperating income to fall 5.9% and 26.7% year-on-year to ?13.2 and ?1.8 billion, respectively.Notes:1. Fiscal years are defined as follows:(1) North America, China, Thailand and Indonesia: January to December 2012(2) Japan and Europe: April 2012 to March 20132. With regard to the transfer of business from Robert Bosch LLC, losses expected to be incurred from the transfer ofthis business have been booked as “provision incurred from transfer of business applied to foreign subsidiaries”under liabilities on the consolidated balance sheet.3. During fiscal year ended March 2011, we recorded ?0.4 billion in operating income in our North American business,but this was due in part to the reversal of ?5.9 billion from “provision incurred from transfer of businessapplied to foreign subsidiaries.” Consequently, the profit recorded during fiscal 2012 reflects the first actual profitrecorded since the fiscal year ended March 2008.Special Feature Social Repor t Environmental Repor t Economic Report Corporate InformationSales Ratio by RegionYear Ended March 31, 2013Europe2.2% Asia11.3%JapanNet Sales 41.2%?206.0billionNorth America45.3%Sales Ratio by ProductYear Ended March 31, 2013Automotivedisc brakes35.7%Automotivedrum brakes13.8%Net Sales?206.0billionAutomotivedisc brakepads 20.2%Cornermodules13.0%Components forrolling stock 1.6%Components forindustrial machinery2.6%Sensors 1.4%Others 0.2%Rotors2.3%Otherautomotiveparts 9.2%Sales Ratio by BusinessYear Ended March 31, 2013Others 0.2%Industrial machinery2.6%Rolling stock 1.6%Sensors 1.4%AutomotiveOEM74.0%Net Sales?206.0billionAutomotiveaftermarket20.2%
元のページ