AKEBONO REPORT 2013
56/72
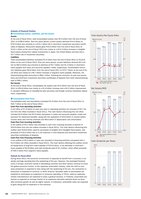
Analysis of Financial Position● Consolidated Assets, Liabilities, and Net AssetsAssetsAt the end of fiscal 2012, total consolidated assets rose ?5.5 billion from the end of fiscal2011 to ?186.6 billion. Over the same period, current assets declined ?14.0 billion to?76.5 billion due primarily to a ?13.1 billion fall in short-term investment securities (certificatesof deposit). Noncurrent assets grew ?19.5 billion from the end of fiscal 2011 to?110.1 billion at the end of fiscal 2012 due mainly to a ?14.3 billion increase in tangiblefixed assets arising from capital investments in Japan, the United States and Asia and a?2.7 billion rise in investment securities.LiabilitiesTotal consolidated liabilities increased ?1.6 billion from the end of fiscal 2011 to ?132.8billion at the end of fiscal 2012. Over the same period, current liabilities declined ?5.2 billionto ?62.0 billion due primarily to declines of ?3.7 billion and ?1.2 billion in short-termloans payable and notes and accounts payable?trade, respectively. Consolidated noncurrentliabilities grew ?6.8 billion from the end of fiscal 2011 to ?70.7 billion at the end of fiscal2012 due mainly to a ?6.7 billion increase in long-term loans payable. Moreover, netinterest-bearing debt amounted to ?68.1 billion, following the exclusion of cash and equivalentsand short-term investment securities (certificates of deposit) from total interest-bearingdebt of ?89.1 billion.Net AssetsAt the end of fiscal 2012, consolidated net assets rose ?4.0 billion from the end of fiscal2011 to ?53.8 billion due mainly to a ?1.8 billion increase and a ?2.2 billion improvementin valuation difference on available-for-sale securities and foreign currency translation adjustment,respectively.● Consolidated Cash FlowsConsolidated cash and equivalents increased ?1.9 billion from the end of fiscal 2011 to?20.7 billion at the end of fiscal 2012.Cash Flow from Operating ActivitiesA net inflow of ?7.6 billion of cash was seen in operating activities (an increase of ?4.7 billionfrom the inflow recorded in fiscal 2011). The main factors influencing this net inflowincluded ?2.6 billion and ?2.9 billion decreases in notes and accounts payable?trade andprovision for retirement benefits, along with the realization of ?3.6 billion in income beforeincome taxes and minority interests and ?8.6 billion in depreciation and amortization.Cash Flow from Investing ActivitiesA net outflow of ?4.1 billion was recorded in cash from investing activities (a decline of?19.8 billion from the net outflow recorded in fiscal 2011). The main factors influencing thisoutflow were ?19.8 billion used for purchases of tangible and intangible fixed assets, andproceeds of ?15.0 billion due to a net reduction in time deposits and short-term investmentsecurities (certificates of deposit).Cash Flow from Financing ActivitiesA net outflow of ?2.0 billion in cash was recorded in financing activities (compared with a?3.5 billion net inflow recorded in fiscal 2011). The main factors affecting this outflow includedrepayments of long term loans payable of ?15.6 billion, a net decrease in short-termloans payable of ?4.8 billion and cash dividends paid of ?1.3 billion, which offset proceedsof ?20.4 billion from long-term loans payable.Outlook for Fiscal 2013During fiscal 2013, the economic environment is expected to benefit from a recovery in corporateearnings resulting from the weakening of the yen. However, the prolonged financialcrisis in Europe, economic trends in developing countries and other factors continue to cloudthe global economic horizon. In the Japanese automobile industry, while the shift to overseasproduction is expected to slow along with the weakening of the yen, the contraction inproduction is expected to continue. In North America, favorable sales of automobiles areexpected to accompany an expansion in consumer spending. In China, sales by Japanesevehicle manufacturers are expected to enjoy a gradual recovery. In Thailand, automobile productionis expected to increase thanks to an expansion domestic demand driven by favorableeconomic growth as well as higher exports. In Indonesia, automobile sales are expectedto grow along with an expansion in the economy.10.0 10.0 10.05.0 5.0(Billions of yen) (%)49.1 49.854.6 53.832.22009 2010 2011 2012 20132009 2010 2011 2012 201303060(50)050Net Assets/ROE(7.1)1.25.811.6(42.2)(Billions of yen)181.0186.6164.1186.0155.4Total Assets/Net Equity Ratio(%)23.9 24.917.626.7 25.4010020004080ROE (%)Net assets (Billions of yen)Net equity ratio (%)Total assets (Billions of yen)(Yen)2009 2010 2011 2012 2013Cash Dividends per Share
元のページ