AKEBONO REPORT 2014
40/72
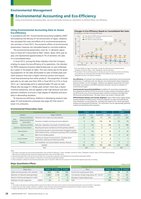
Environmental ManagementEnvironmental Accounting and Eco-efficiencyUsing environmental accounting data, we are continually revising our operations to achieve better eco-efficiency.Using Environmental Accounting Data to AssessEco-efficiencyIn accordance with the “Environmental Accounting Guidelines 2005”formulated by the Ministry of the Environment of Japan, Akebonohas calculated the costs and effects of its environmental preservationactivities in fiscal 2013. The economic effects of environmentalpreservation measures are calculated based on concrete evidence.The environmental preservation costs for 11 domestic operationsin fiscal 2013 amounted to ?661 million, down 20% year onyear, and represented approximately 0.7% of domestic net saleson a consolidated basis.In fiscal 2013, among the three indicators that the Companyemploys to assess the eco-efficiency of its operations, the indicatorfor PRTR substance emissions deteriorated year on year (indicatedby in green in the graph at right). This was mainly due to the growingproportion of net sales attributable to sales of brake pads andother products that have a higher chemical content and requiremore heat processing than other products. The proportion of brakepad sales to net sales rose from 20% in fiscal 2012 to 21% in fiscal2013, up 1 percentage point or approximately 5% year on year.(Please also see page 51.) Brake pads contain more than a dozenchemical substances, and are applied under high pressure and temperatureconditions to ensure a high degree of reliability and durabilityin demanding situations.To improve eco-efficiency, Akebono is developing products (seepage 37) and production processes (see page 42) that result inlower CO2 emissions.Eco-efficiency: An indicator that integrates economic performance and environmentalperformance. It is defined as the net sales per unit environmental impact imposed bybusiness activities. For this evaluation, Akebono has adopted measurements of industrialwaste, CO2 emissions and PRTR substances (emission volume) as indicators ofenvironmental impact.Environmental Accounting Guidelines: Guidelines for accounting managementformulated by the Ministry of the Environment of Japan aimed at providing a methodfor defining the costs of environmental impact reduction activities to elucidate theireffectiveness and performance. The latest version was issued in February 2005.PRTR (Pollutant Release and Transfer Register): Japan’s PRTR system legally obligesbusiness operators handling certain chemical substances to collect and publically discloseinformation on said substances, including with regard to the volume generated,emitted and transported off premises. This information must be appropriately gathered,verified and reported by those operators.* From fiscal 2009, the scope of calculation includes the following seven production plants:Yamagata, Fukushima, Miharu, Iwaki, Tatebayashi, Iwatsuki and Sanyo.** The decrease in the eco-efficiency base on net sales per unit CO2 emissions and the eco-efficiencyof net sales per unit waste generation recorded in fiscal 2009 was due to the inclusion ofTatebayashi Foundry in the scope of calculation.’04 ’05 ’06 ’07 ’08 ’09* ’10 ’11 ’12 ’13 (FY)(Benchmark year)3.02.02.51.51.00.51.031.071.281.001.021.031.031.611.101.001.822.182.442.112.492.270.91** 0.96 0.98 0.920.61 0.530.950.61** 0.59 0.551.100.97Base unit (fiscal 2004 = 1.00)Net sales/unit PRTR substances (emission volume)Net sales/unit CO2 emissionsNet sales/unit waste generationChanges in Eco-Efficiency Based on Consolidated Net Sales(Eco-efficiency = Net sales / Environmental impact)Environmental Preservation Costs (millions of yen)Environmental preservation costs FY2011 FY2012 FY2013Category Major initiatives Investment Costs Investment Costs Investment CostsMainbusinesssegmentPollution prevention Prevention of air, water and noise pollution 36 352 37 241 71 204GlobalenvironmentalpreservationPrevention of global warming and ozone depletion 0 66 145 84 54 59Resource recycling Reduction, disposition and recycle of industrial waste 0 174 0 186 0 188Upstream and downstream Recycling and reuse of products and their packing materials 0 3 0 -3 0 0AdministrativeEnvironmentaleducation and environmental management system(EMS) related activities, including the acquiring of EMS certification 0 63 0 46 0 34R&D R&D of eco-friendly products 0 120 0 78 0 45Social activitiesInitiatives to improve the environment, including naturepreservation, planting and cleaning activities 0 11 0 8 1 5Recovery Soil remediation and natural disaster recovery measures 0 0 0 0 0 0Subtotal 36 791 182 640 126 535Total 827 822 661Notes:1. The scope of calculation for environmental preservation costs includes the following 11 bases: Yamagata, Fukushima, Miharu, Tatebayashi, Iwatsuki, Sanyo, ACW (including purchasing),R&D sections (including Ai-Ring), production engineering sections, Alocs and the R&D Centre.2. Environmental preservation costs are the amount spent for such activities as operation and maintenance of environment preservation facilities.3. Value of investment is amount invested on introduction of environment preservation facilities.4. Values indicated in subtotal of environmental preservation costs in fiscal 2011 differ from the actual sum of costs for the respective years due to rounding.Major Quantitative Effects (millions of yen)Quantitative effects (reduction from the previous year) Economic effects of environmental preservation measuresMajor items FY2011 FY2012 FY2013 Effect FY2011 FY2012 FY2013Global warming prevention (CO2 reduction) t-CO2 -900 -1,900 700 Income from recycling and others 69 68 87Reduction of industrial waste generated t -1,800 3,100 500 Cost reduction through energy saving, VA*1 and VE*2 317 162 181Reduction of industrial waste disposed of in landfills t 0 0 0 Decrease of waste disposal costs 98 71 47Reduction of water usage level 1,000m3 20 0 10 Total 484 302 315Notes:*1 The scope of calculation of quantitative effects and economic effects is the same as that used for environmental preservation costs and includes 11 operations.*2 Values with a plus sign indicate a reduction. In addition, values have been retroactively adjusted accompanying the change in scope of calculation.*3 Figures indicating economic effects for fiscal 2012 do not add up to 302 due to rounding.
元のページ