AKEBONO REPORT 2014
53/72
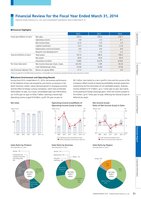
Financial Highlights2012 2013 2014Fiscal year (billions of yen): Net sales 209.6 206.0 236.7Operating income 3.8 4.3 8.1Net income (loss) (3.2) 0.5 2.4Capital investment 14.3 19.8 21.8Depreciation and amortization 9.8 8.6 8.9Research and development* 1.7 2.3 2.3Year-end (billions of yen): Total assets 181.0 186.6 199.2Net assets 49.8 53.8 60.4Associates (number) 7,800 8,279 8,505Per share data (yen): Net income (loss) per share?basic (24.25) 3.90 18.24Cash dividends per share 10.00 10.00 10.00Key financial indicator (%): Return on equity (ROE) (7.1) 1.2 4.9*Please see page 64 for total R&D-related expenditures, including R&D costs and expenses associated with day-to-day improvement activities.Financial Review for the Fiscal Year Ended March 31, 2014Akebono Brake Industry Co., Ltd. and Consolidated Subsidiaries Years Ended March 31Net Sales?236.7billionAutomotivedisc brakes37%Automotivedrum brakes13%Automotivedisc brake pads21%Components forindustrial machineryand rolling stock4%Sensors 1%Otherautomotiveparts24% Net Sales?236.7billionOthers 1%Industrialmachinery 2%Rolling stock 2%Sensors 1%AutomotiveOEM73%Automotiveaftermarket21%Net Sales?236.7billionEurope 3%Asia13%Japan35%North America49%Sales Ratio by ProductYear Ended March 31, 2014Sales Ratio by BusinessYear Ended March 31, 2014Sales Ratio by RegionYear Ended March 31, 2014 Business Environment and Operating ResultsDuring fiscal 2013, ended March 31, 2014, the business performanceof the Akebono Group was buoyed by such factors as recovery in theNorth American market, robust demand growth in emerging countriesand the effect of foreign currency translation, which had contributed?28.6 billion to sales. As a result, consolidated sales rose ?30.6 billion,up 14.9% year on year, to ?236.7 billion, reaching a record high.Operating income surged ?3.8 billion, up 87.3% year on year to?8.1 billion, due mainly to a rise in profit in Asia and the success of theCompany’s efforts aimed at improving profitability through productionstreamlining and the elimination of non-profitable projects. Ordinaryincome climbed to ?7.3 billion, up 2.1 times year on year, due mainlyto the posting of foreign exchange gains, while net income jumped to?2.4 billion, up 4.7 times year on year, reflecting the reversal of part ofdeferred tax assets.236.7130.6216.6 209.6 206.0(Billions of yen)(FY)01302602009 2010 2011 2012 201311.43.84.7 4.38.12.13.43.65.31.8Operating income (loss) (billions of yen)Ratio of operating income (loss) to sales (%)(%)2009 2010 2011 2012 201305101502.04.06.0(Billions of yen)(FY) 2009 2010 2011 2012 20130.52.15.30.31.02.41.62.4(1.5)(3.2)04804.08.0(4) (4.0)(Billions of yen) (%)(FY)Net income (loss) (billions of yen)Ratio of net income (loss) to sales (%)Net Sales Operating Income (Loss)/Ratio ofOperating Income (Loss) to SalesNet Income (Loss)/Ratio of Net Income (Loss) to Sales
元のページ