AKEBONO REPORT 2014
56/72
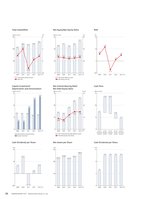
(Billions of yen)199.2164.1186.0 181.0186.61.3 1.33.0(1.8)0.32009 2010 2011 2012 2013 (FY)080160240(%)(3)036Total Assets (billions of yen)ROA (%)19.821.85.4 5.114.38.6 8.910.0 9.8 9.82009 2010 2011 2012 2013081624Depreciation and amortizationCapital investment(Billions of yen)(FY)17.8 18.3439.75(24.25)3.902009 2010 2011 2012 2013(30)03060(Yen)(FY)Total Assets/ROACapital Investment/Depreciation and AmortizationCash Dividends per Share52.743.847.143.346.52009 2010 2011 2012 20130204060020406026.7 25.4 26.423.9 24.9(Billions of yen)(FY)(%)Net equity (billions of yen)Net equity ratio (%)76.239.536.952.468.11.450.900.781.21.462009 2010 2011 2012 201303060900.01.02.03.0(Billions of yen)(FY)(Times)Net interest-bearing debt (billions of yen)Net debt-equity ratio (times)396.40330.76355.88326.39350.522009 2010 2011 2012 20130150300450(Yen)(FY)Net Equity/Net Equity RatioNet Interest-Bearing Debt/Net Debt-Equity RatioNet Assets per Share(%)2009 2010 2011 2012 2013 (FY)(10)010204.95.811.6(7.1)1.2(Billions of yen)13.520.7+18.9 (20.3)(5.8)CF frominvestmentactivitiesCF fromfinancialactivities2014/3/31Cash and cashequivalents2013/4/1Cash and cashequivalentsCF fromoperatingactivities015304510.05.010.0 10.0 10.02009 2010 2011 2012 201304812(Yen)(FY)ROECash Flow
元のページ