


With Our Associates and Their Families
A Look at Our Associates
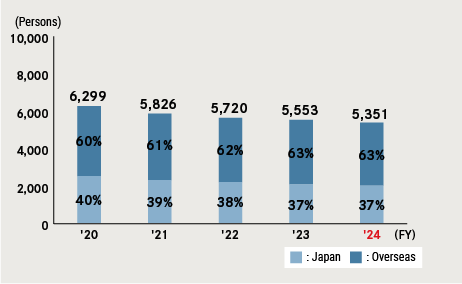
Number of Associates (Consolidated Basis) and Ratio of Japanese and Overseas Associates (%)
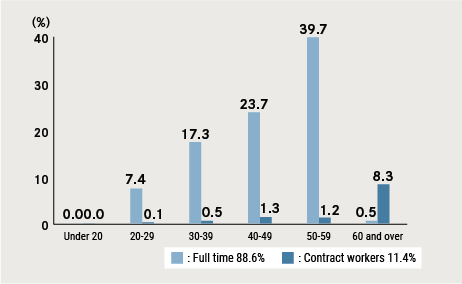
Ratio of Associates by Age (Japan) (fiscal 2024)
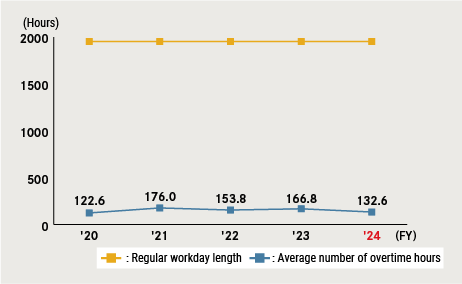
Workday Length (Japan)
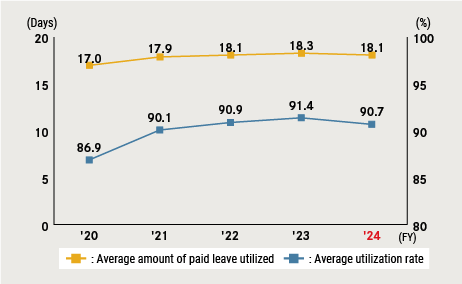
Average Amount of Paid Leave Utilized/Average Utilization Rate (Japan)
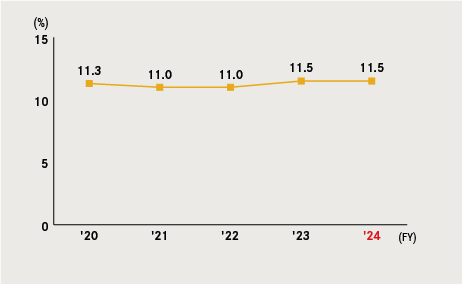
Ratio of Female Associates (Japan)
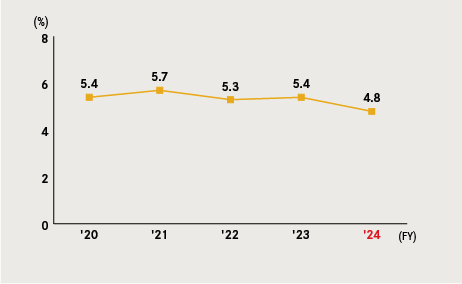
Ratio of Female Associates in Managerial Positions (Japan)
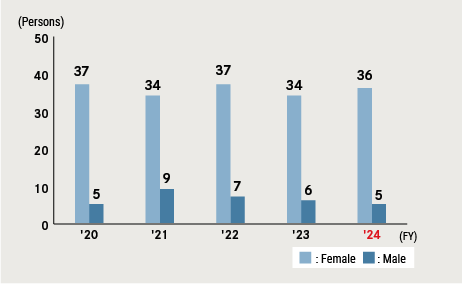
Shorter Working Hours due to Child Care (Japan)
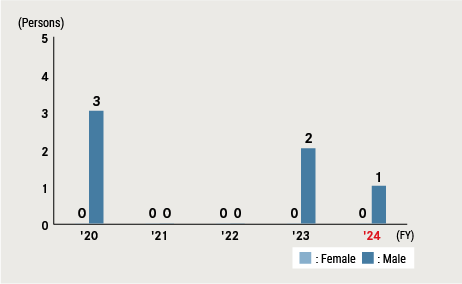
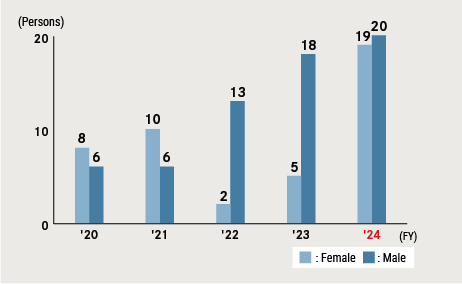
Child Care Leave (Japan)
Family Care Leave (Japan)